
Abstract
Background. Circulating tumor plasma cells (CTCs) are independent prognostic biomarkers in NDMM patients (pts), but their relevance in the context of R2-ISS and the new IMS-IMWG Consensus Genomic Staging (CGS) has not been investigated. We aimed to evaluate the clinical significance of CTCs in combination with R2-ISS and CGS in a large cohort of NDMM pts.
Methods. The European CTC Consortium collected patient-level data of NDMM pts from 6 collaborative groups (Czech Republic, Greece, Italy, HOVON/the Netherlands-Belgium, IFM/France, PETHEMA/Spain) with the support of the European Myeloma Network (EMN). CTC enumeration by flow cytometry prior to treatment was available in all pts. To investigate the role of CTCs in combination with R2-ISS (D’Agostino et al. JCO 2022), we analyzed 1673 NDMM pts (R2-ISS cohort) with complete data on R2-ISS defining variables. To investigate the role of CTCs in combination with CGS, we analyzed 190 NDMM pts (CGS cohort) with molecular data available. CGS high risk was defined as per IMS/IMWG recommendations (Avet-Loiseau et al. JCO 2025). In both cohorts, CTCs were analyzed as log10 increase (discrete intervals from ≤0.001% to >1%) and using a binary cutoff (≤0.02% vs >0.02%).
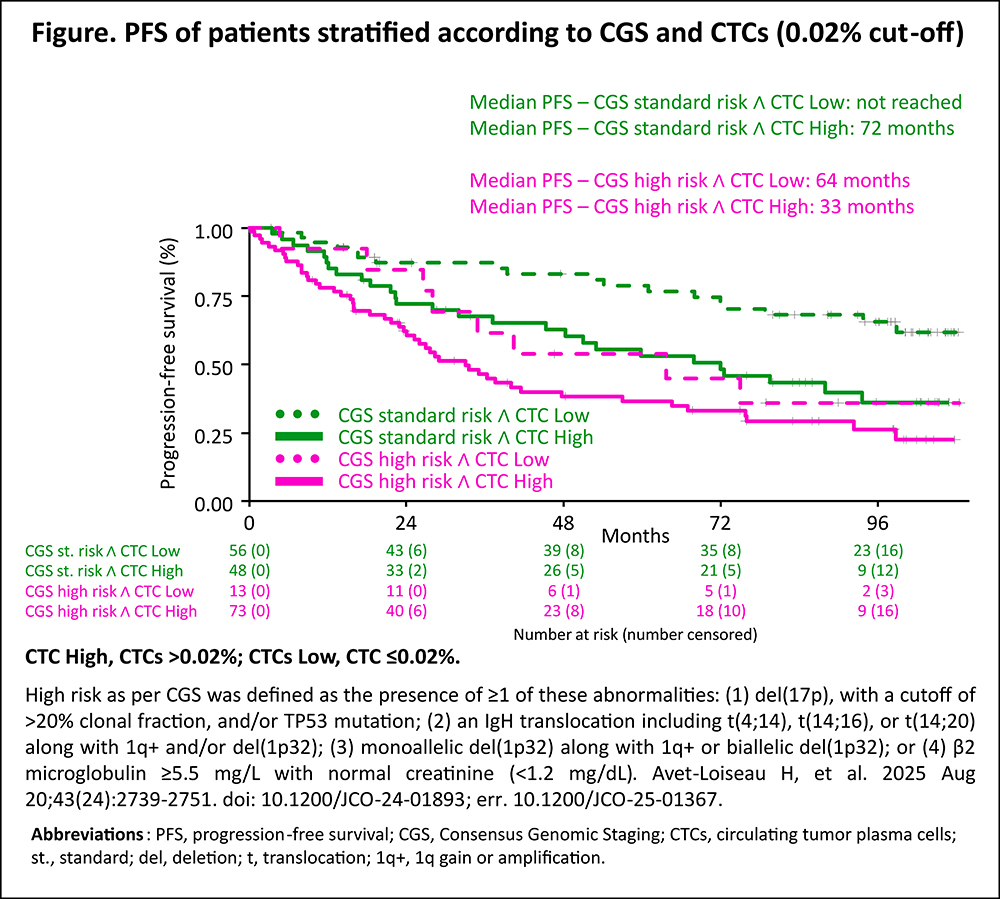
Results. In the R2-ISS cohort, 17% of pts had R2-ISS stage I, 28% II, 46% III and 9% IV. The distribution of pts with ≤0.001%, ≤0.01%, ≤0.1%, ≤1% and >1% of CTCs was 20%, 20%, 31%, 18% and 10%. After a median follow-up of 49 months, both CTCs log10 increments (HR 1.16 [95% CI 1.11–1.22]; p<0.001) and R2-ISS (R2-ISS II vs I: HR 1.19 [95% CI 0.93–1.53]; III vs I: 1.69 [1.34–2.14]; IV vs I: HR 2.78 [2.08–3.72]; p<0.001) were independent predictors of PFS in a multivariable model including center, transplant eligibility, treatment regimen and age. A PFS model including CTCs as log10 intervals + R2-ISS (C-index 0.708) or CTCs with a binary cut-off + R2-ISS (C-index 0.703) performed better than R2-ISS alone (C-index 0.695, likelihood ratio test vs R2-ISS p<0.001). Using a 0.02% cut-off, in R2-ISS I 78% vs 22% of pts had low vs high CTCs (median PFS: 99 vs 72 months); in R2-ISS II 60% vs 40% (median PFS: 78 vs 48 months); in R2-ISS III 41% vs 59% (median PFS 40 vs 32 months); in R2-ISS IV 22% vs 78% (median PFS 24 vs 15 months; p<0.001). In the CGS cohort, 45% of pts were at high risk. The distribution of pts with ≤0.001%, ≤0.01%, ≤0.1%, ≤1% and >1% of CTCs was 17%, 9%, 31%, 29% and 13%. After a median follow-up of 91 months, both CTC log10 increments (HR 1.31 [95% CI 1.13–1.52]; p<0.001) and CGS high risk (1.55 [1.01–2.39]; p=0.047) were independent predictors of PFS. A PFS model including CTCs as log10 intervals + CGS (C-index 0.669) or CTCs with a binary cut-off + CGS (C-index 0.650) performed better than a model with CGS alone (C-index 0.620, likelihood ratio test vs CGS p<0.006). Using a 0.02% cut-off, 29% of pts were classified as CGS standard risk + low CTCs, 25% as CGS standard risk + high CTCs, 7% as CGS high risk + low CTCs and 38% as CGS high risk + high CTCs. Median PFS was not reached in CGS standard risk + low CTCs, 72 months in CGS standard risk + high CTCs, 64 months in CGS high risk + low CTCs and 33 months in CGS high risk + high CTCs (p<0.001; Figure).
Conclusions. CTC levels had independent prognostic value in NDMM pts stratified with R2-ISS and IMS-IMWG CGS. These data support the investigation of CTCs in combination with current prognostic models and high-risk definitions.

Footnotes
Disclosures
No Conflict of interest.
Funding
No funding.
Figures & Tables
Article Information

This work is licensed under a Creative Commons Attribution-NonCommercial 4.0 International License.